Images and Noise
An image signal can have noise introduced at many stages including digitization, or transmission. There are two types of noise that are of specific interest in image analysis.
- Signal-independent = a random set of grey levels, statistically
independent of the image pixel values that is added to the pixels in the
image:
I' = I + N
Where I is the perfect image and N is the noise added resulting in the noisy image I'.
Noise that is added during transmission of an image is usually signal-independent!
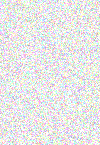
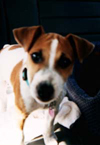
I' N I
An easy way to measure the amount of noise
If it is possible to issolate a region of the image that should have a uniform grey level, e.g. the black background in the upper right corner, and the noise is uniform and constant, then the amount of noise can be measured. The variation then of the pixel values in this region is direct result of the noise. Noise can be characterized by:m = mean std = standard deviation
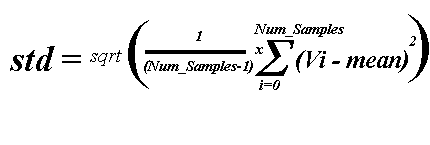
The mean is the average value of the noise signal whereas the standard deviation is the square root of the variance. Given a set of values Vi, the following are calculations: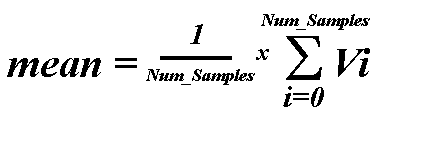
Exercise
- Signal-dependent - the level of the noise value at each pixel corresponds to the pixel value there. This kind of noise is harder to deal with but, fortunately is less often of importance. Trying to find this correspondence can be difficult and in some cases impossible to find.
Noise is usually described by its probabilistic characteristics.
- White noise - constant power spectrum (its intensity does not decrease with increasing frequency); very crude approximation of image noise
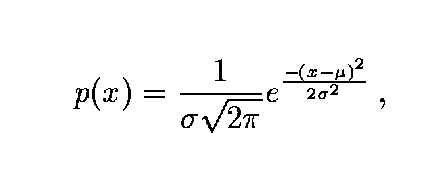
- Gaussian noise is a very good approximation of noise that occurs in many practical cases
- probability density of the random variable is given by the Gaussian curve;
- 1D Gaussian noise - µ is the mean and is the standard deviation of the random variable.
Shot Noise Example
Reducing Noise through Ensembles of Images
Suppose that we take one picture of a scene, then another, and another, and another. Because of random variations in light, the random distribution of molecules of air in the path of the light, the random distribution of silver-halide grains in film, etc., we'll never quite get exactly the same picture twice.
We can consider the picture, P(r,c) as a random variable from
which we sample an ensemble of images from the space of all possibilities. This
ensemble has a mean (average) image, which we'll denote as Pmean(r,c).
As with most stochastic processes, if we sample enough images, the
ensemble mean approaches the noise-free original signal.
So, one way to often eliminate noise is to take a lot of pictures.
However, this usually isn't feasible.
If we compare the strength of a signal or image (the mean of the
ensemble) to the variance between individual acquired images we get a
signal-to-noise ratio, SNR:
SNR = mean/standard_deviation
A high signal-to-noise ratio indicates a relatively clean signal or image;
a low signal-to-noise ratio indicates that the noise is great enough to impair
our ability to discern the signal in it. | In-Class Assignment/Exercise The files Orig_N*.jpg contains a sequence of images corrupted by noise. Average any number (2..4) of these images together to reduce the noise. Display the result. Why does this work? How many is enough? How can you tell?
Original Image 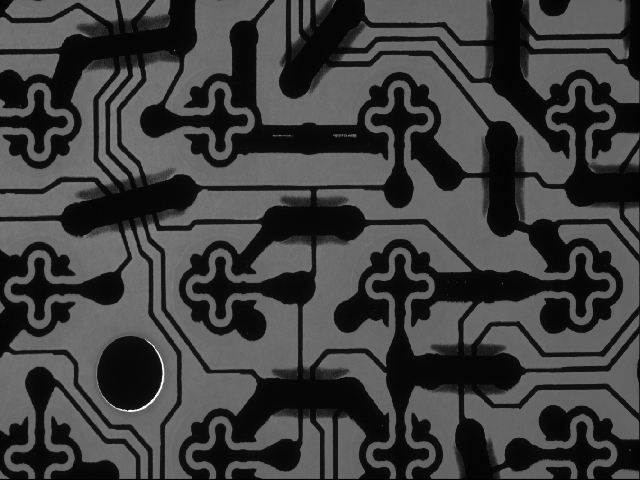
|
Reducing Noise through Averaging or Media Filters
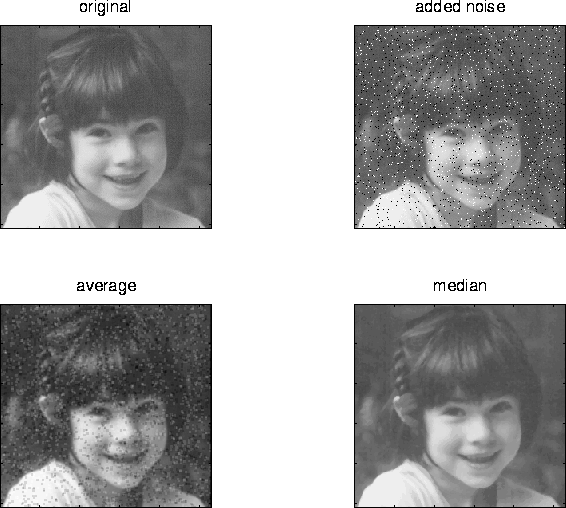
Figure:Original image, w/ salt&pepper noise, result after averaging/smoothing filter, result after median filter.
Reducing Noise via Frequency Domain Processing
