SOME SW Engineering DevelopmentProcess Metrics
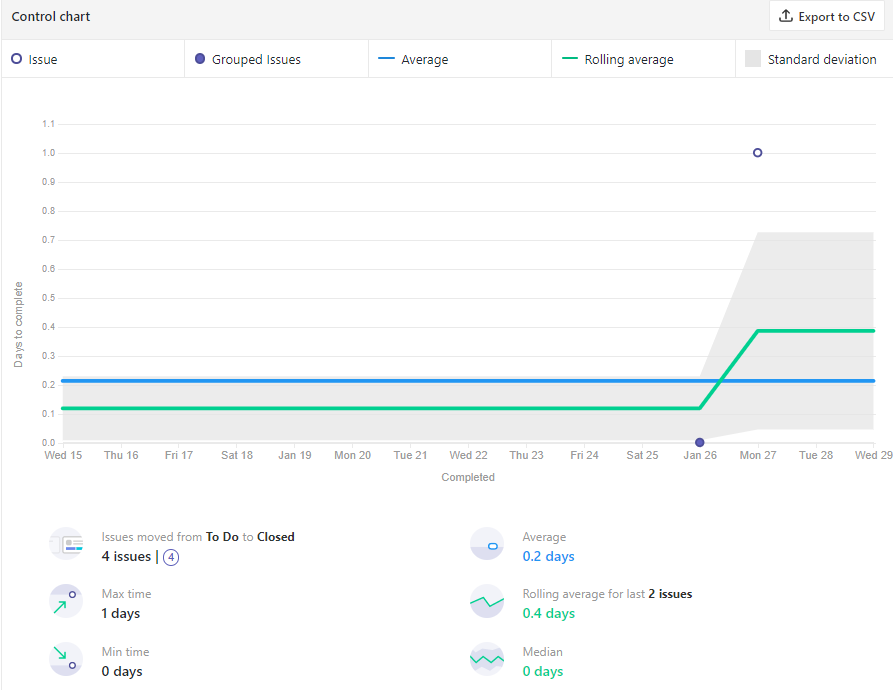
Cycle time
Cycle time describes how long it takes to change the software system and implement that change in production.
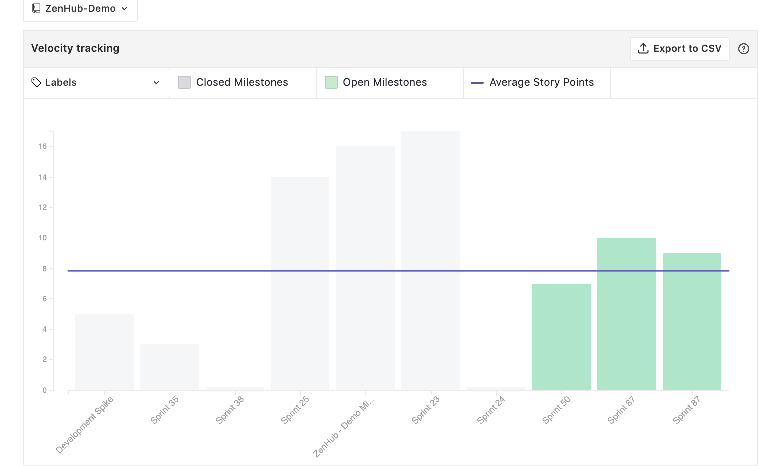
Team velocity
Team velocity measures how many software units a team completes in an iteration or sprint.
ZenHub Velocity Chart (Milestone = sprint)
Open/close rates
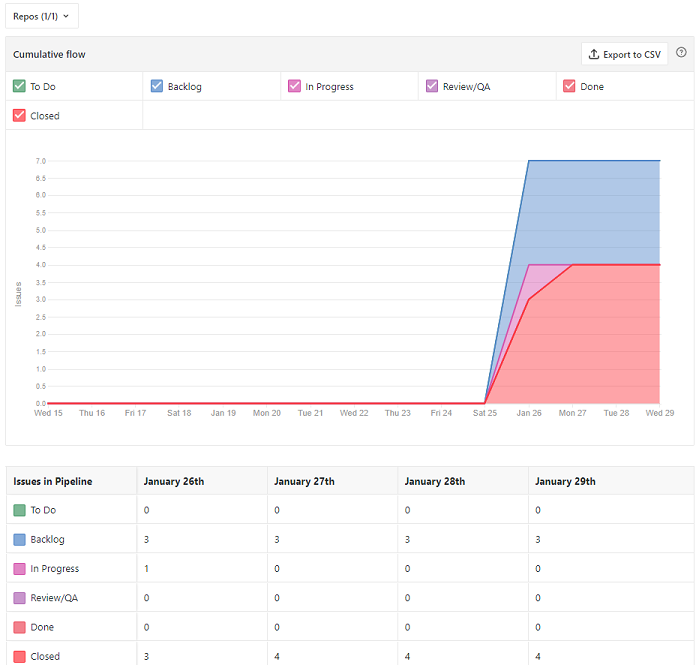
Open/close rates are calculated by tracking production issues reported in a specific time period.
- ZenHub Cummulative Flow Chart
Effort and Staffing
must be tracked because they tend to be the primary cost drivers in knowledge-intensive work.
Quality and Customer Satisfaction
The focus on frequent delivery of working software engages the customer in looking at the product itself. A strong focus on verification criteria (frequently called "definition of done")
Active days
Active days is a measure of how much time a software developer contributes code to the software development project. This does not include planning and administrative tasks.
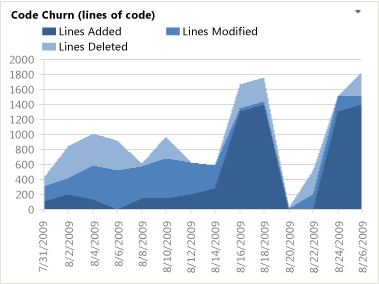
Code churn
Code churn represents the number of lines of code that were modified, added or deleted in a specified period of time. If code churn increases, then it could be a sign that the software development project needs attention
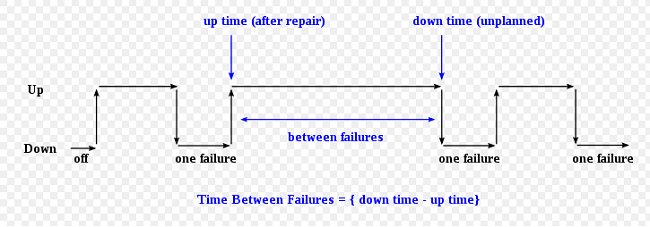
Mean time between failures (MTBF) and mean time to recover/repair (MTTR)
Both metrics measure how the software performs in the production environment. Since software failures are almost unavoidable, these software metrics attempt to quantify how well the software recovers and preserves data.
.
Application crash rate (ACR)
Application crash rate is calculated by dividing how many times an application fails (F) by how many times it is used (U).
ACR = F/U
Size Related Metrics [KLOC = # K (thousands) lines of code]
-
Errors per KLOC
-
Defects per KLOC
-
Cost per KLOC
Defect Removal Efficiency (DRE)
The Defect Removal Efficiency is used to quantify how many defects were found by the end user after product delivery (D) in relation to the errors found before product delivery (E). The formula is:
DRE = E / (E+D)
